
Unlocking the Power of Data for Communities: A Call To Action

Awareness, transparency, and engagement are hallmarks of a thriving community. Information – data – is what drives engagement. Traditionally, data about community issues and resources has been difficult to amass and present in an easy-to-read way. Thoughtfully-told data stories allow for more understanding, amplifying community awareness. At Boulder Insight Group (BIG), we’ve long believed in […]
Don’t let Ventura turn you into a Tab-loo-hoo-zuh-her

As a company, we ran into an interesting issue this week where our favorite datawarehouse, Snowflake, wasn’t connecting to Tableau Desktop. This was only happening with some of our employees – specifically those not using PCs. After a lot of troubleshooting, we discovered that Macs currently running macOS Ventura couldn’t recognize the driver needed to […]
Friends Don’t Let Friends Struggle with Tableau: The One with Easy Naming Conventions

I recently wrote about how some people often have the urge to verify data in Data Visualizations, and some steps we take to keep governance, and help people trust the data. Despite that – people (finance…) – are still going to want to check. And for those folks, there are other things we can do […]
Tableau and Chill? Only After a Double-Check with Excel!
It used to be the norm for people to download data from Tableau then check it against formulas they kept in Excel. People are now more trusting of data visualizations (i.e. dashboards) but from time to time, they fall back to their old ways of checking the calcs, and they feel more comfortable doing that […]
I Can See Clearly Now

We have several clients who insist on a light background with dark text. Despite my sunny personality, I always gravitate towards a darker background with light text, but that is not just because of look or feel. White is the brightest color, and our eyes are always drawn to the brightest color. People shouldn’t be […]
Bridging the Gap with a Guide
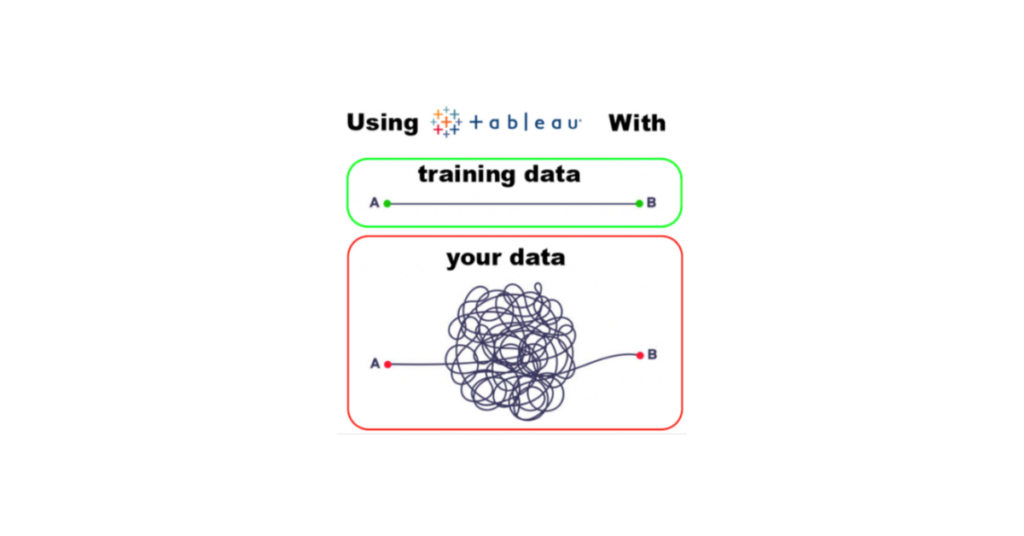
When Training Data Just Isn’t Enough Written by Heather Ditillo I loved being a road warrior, traveling the country teaching Tableau and helping my students gain the confidence to be less intimidated by the technology and the skills they needed to better see and understand their data. When travel was curtailed in 2020 I started […]
Sugar-Coating Your Data
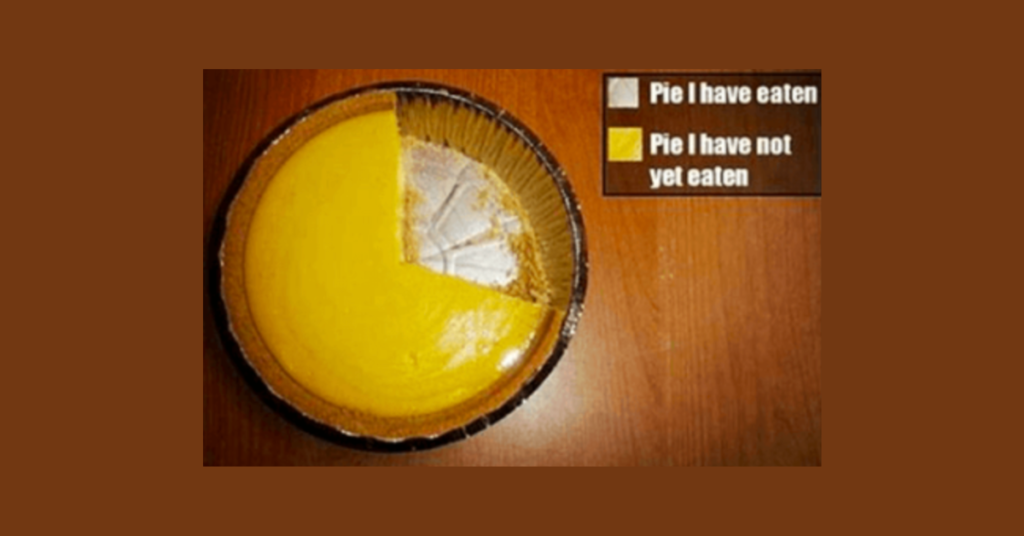
When Radial Pie Charts Serve Up More Style Than Substance Tableau Public is promoting radial pie charts and I don’t understand why. Radial charts are just tarted-up pie charts and pie charts are, on their own, terrible ways to communicate more than two pieces of data. Making a radial chart is like adding chaos on […]
Four Key Ways to Handle Tableaut (ta.BLOAT)

tableaut /ta.bloat/ noun def: When your Tableau Server has too many dashboards, making users too overwhelmed to make confident decisions. “If we don’t consolidate these dashboards now, our case of Tableaut is just going to get worse.” Similar: inDATAgestion, OverGraphed, PieEyed Tableau makes it super easy to create content – that’s the good news. […]
Knowledge-Driven Business Strategy

You’re Going to Need A Smarter Boat Data Driven Business (DDB) has been a buzz phrase for a hot minute. Although I agree in spirit of what DDB stands for, it just has never seemed quite right to me. I’ve been in the Business Intelligence industry for 20 years, and I’ve seen lots of clients […]